Say hello to improved Cloud analytics

When we originally introduced LiveKit Cloud, we also launched a realtime analytics and telemetry product to give you insights into how your users interacted with your LiveKit applications. Over the past two years, LiveKit Cloud has grown significantly, powering realtime applications ranging from AI assistants to robotic pile drivers to 911 emergency calls. Concurrent events increased 20 fold last year, and as traffic over our network scaled up, our in-house data processing pipelines started to struggle. This led to slow page-loading times and delayed or inaccurate metrics reports.
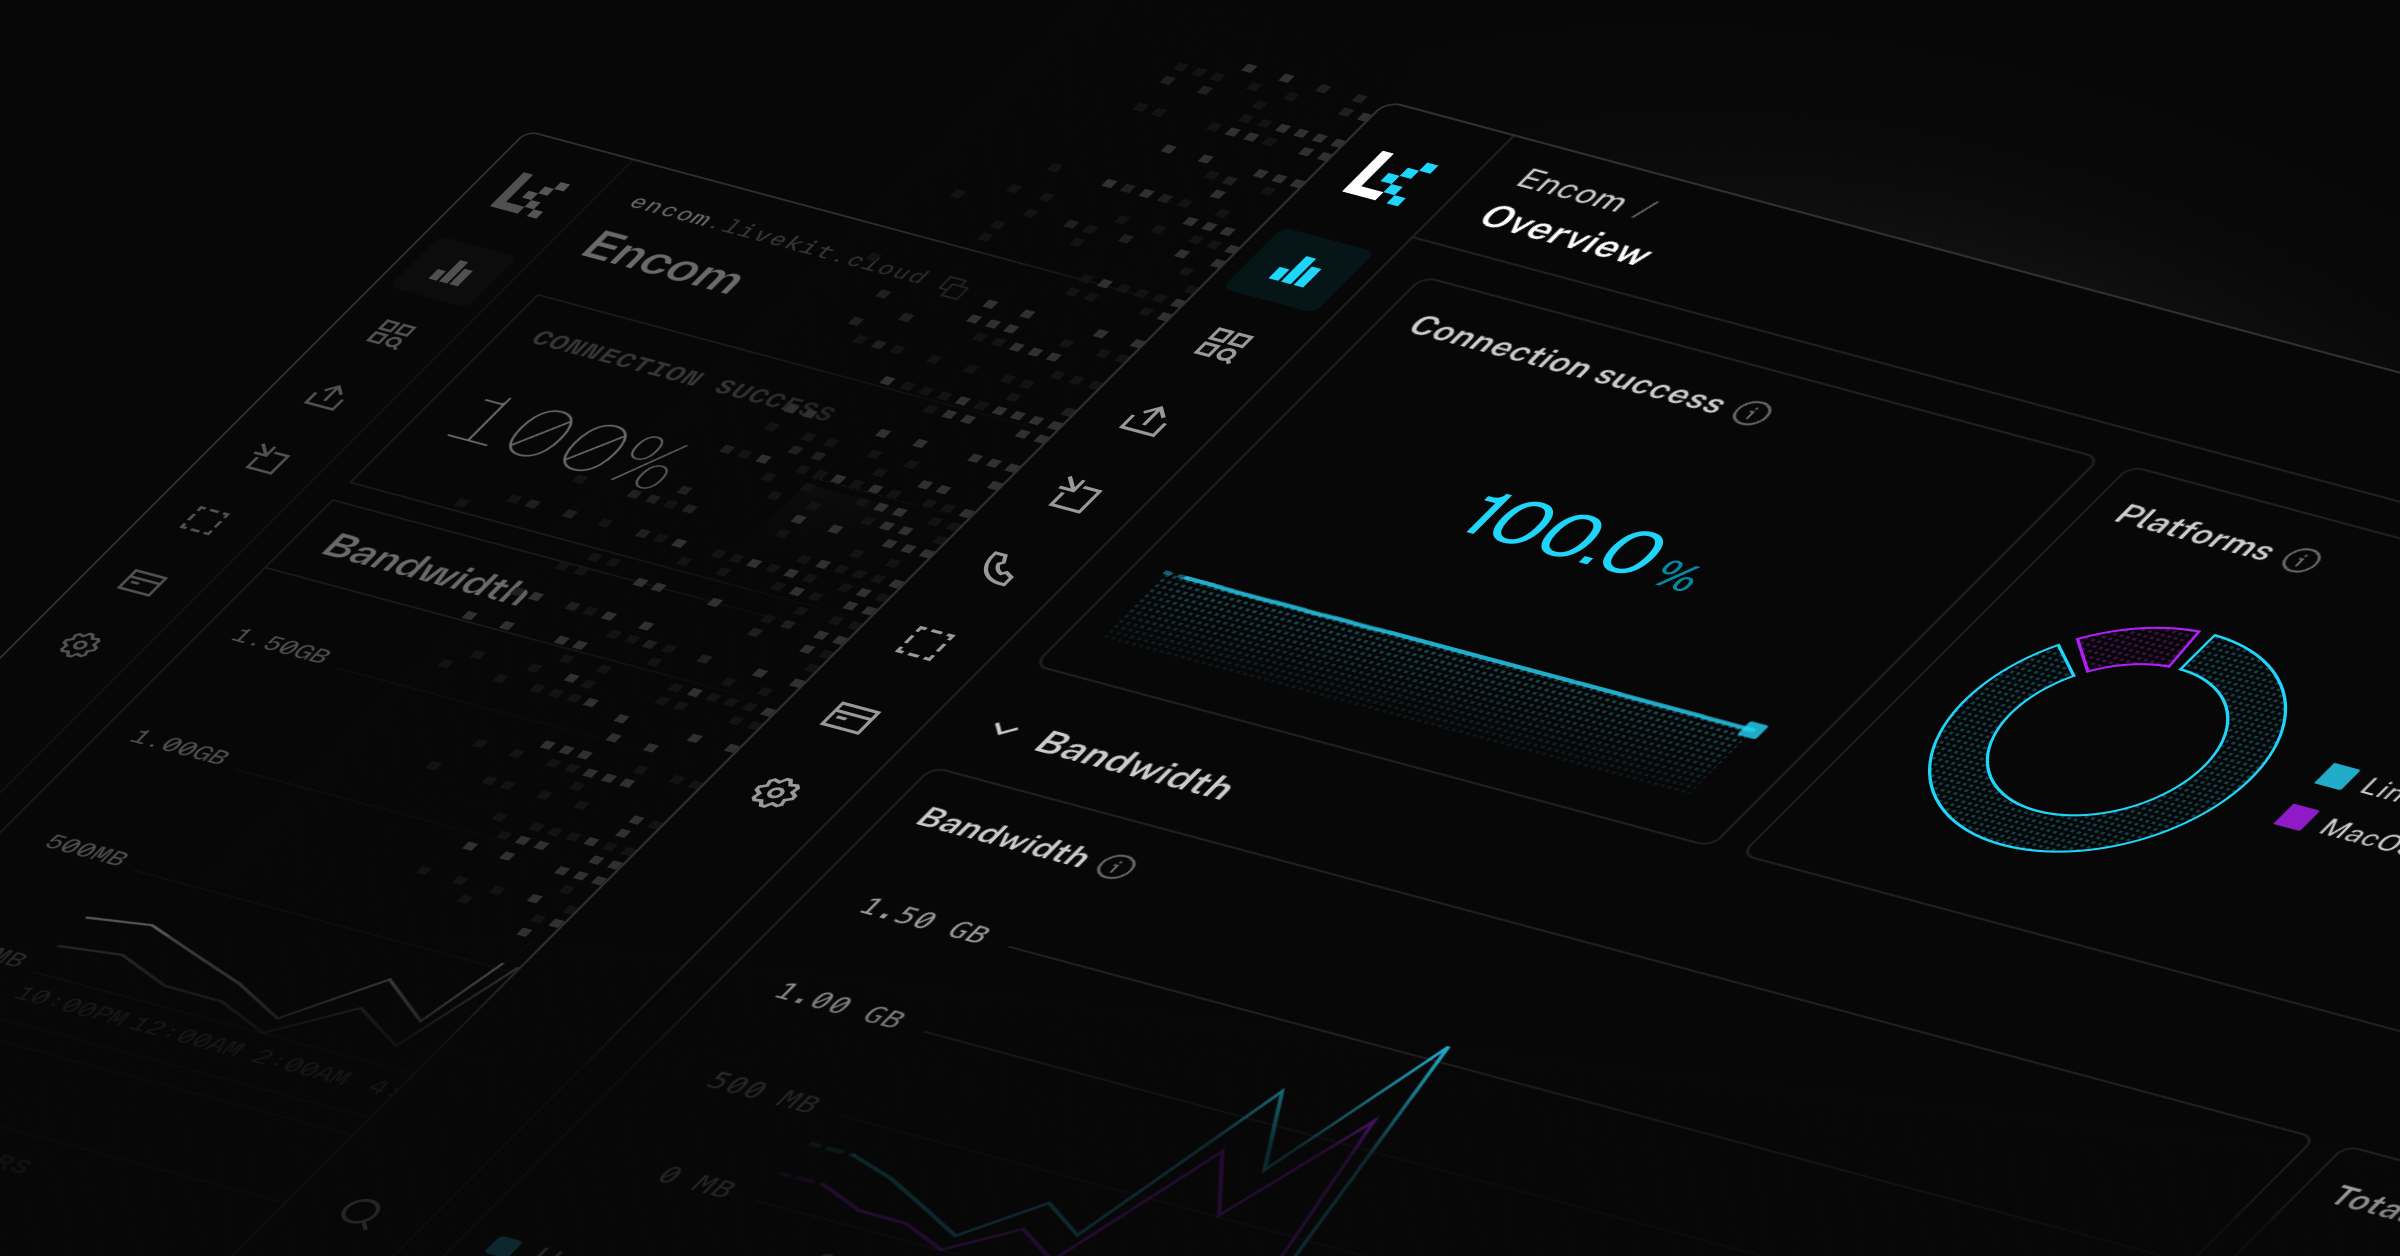
Today, we're rolling out a major redesign (backed by a complete infrastructure rebuild) of LiveKit Cloud analytics, with significant improvements to performance and usability. This new version is built to handle large-scale applications and in a future post we’ll write all about the engineering challenges we faced in building our new analytics stack.
Here’s a quick rundown of everything that’s new in analytics v2:
Faster load times
The first thing you’ll notice about the new dashboard is it loads faster. We now run our data processing pipeline in the background on an interval and stream incremental updates to the client.
Better navigation and layout
You can move between session and participant pages using a consistent breadcrumb system. Each page is divided into tiles and collapsible sections to improve focus and we’ve adjusted colors, typography, layout and spacing with readability and accessibility in mind. To quickly pull up any session or participant, we’ve made universal search more reliable, too.
New insights
On sessions pages, we’ve added total connection minutes, connection quality and latency metrics, and on participant pages, the time it took to connect to LiveKit Cloud’s network. For projects using SIP, we’ve shipped new call logs with telephony observability and analytics.
More controls
You can now filter data tables and slice results by specific attributes or time ranges. When you select a time range, all graphs on a page will scope to that range, making it easier to get a comprehensive view across metrics and debug sessions. Each filter setting and/or time range is captured as a URL param, so you can share a specific dashboard state with your team. Analytics data also live updates; each page has a refresh interval control which will pull in new information automatically, from every minute to once a day.
Check out the new updates and let us know what you think — all of the aforementioned changes and improvements were a direct result of feedback we’ve heard from the LiveKit community.
Over the coming months, we plan to continue improving the level of observability you have over your realtime applications. One area we’re particularly focused on is voice agents built with the Agents framework and telephony. Stay tuned!