Streamline troubleshooting with Agent Observability


Your voice agent feels slow. One user reports it interrupted them mid-sentence. Another says it failed to complete a task. You know something went wrong, but figuring out what requires jumping between your LLM provider’s dashboard, your transcription service’s logs, and your own server logs, trying to correlate timestamps and guess at what happened when.
With text-based apps, a few extra seconds of latency often goes unnoticed. In live conversations, timing is everything. If your voice agent takes too long to respond or cuts someone off, the experience breaks immediately. The hard part is pinpointing the root cause: was it the model, transcription, network, turn detection, or some combination of all of them? Up until now, that usually meant stitching together data across the entire pipeline by hand.
Today, we’re launching the beta release of Agent Observability in the LiveKit Cloud Dashboard. For any agent session, you can now review synchronized audio playback, transcripts, turn-by-turn traces, and logs in a single place.
See (and hear) what actually happened in a session
LiveKit powers the full voice agent stack, from streaming audio and managing turn-taking to routing requests between your agent code and model providers. That means we already have the complete picture of what happened during a session.
Agent Observability makes that picture visible and actionable.
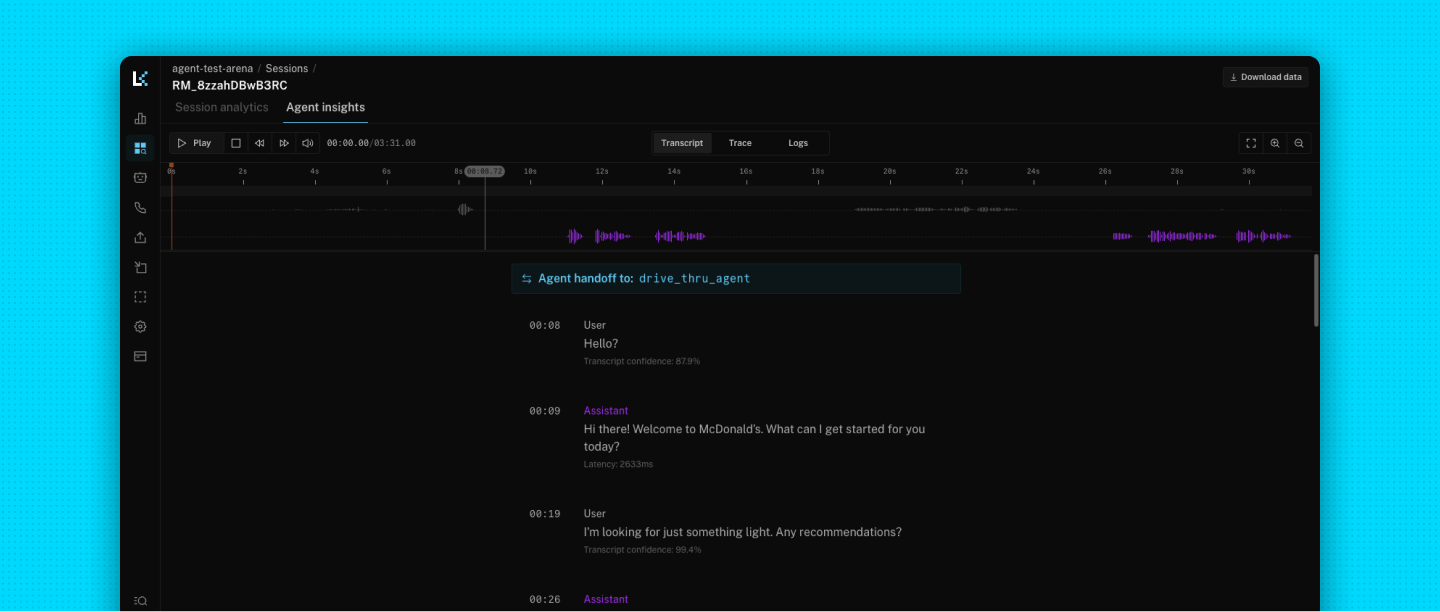
When you open a session in your dashboard, you’ll see a new tab called Agent insights. Inside, you’ll find three views, all synced to the playback timeline:
Transcript
The first view is the conversation timeline with audio playback. Scrub to any point in the session to see exactly what the user and agent said. Inline alerts highlight key events such as tool calls and agent handoffs so you can immediately jump to the moments that matter most.
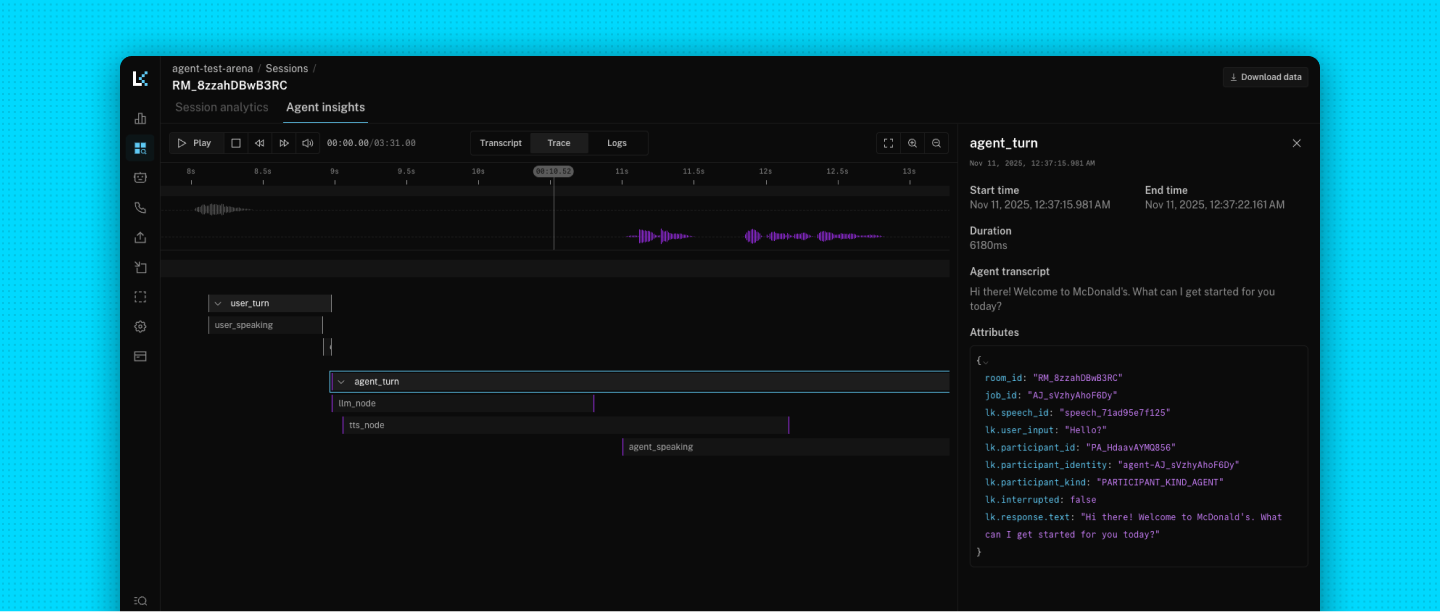
Trace
Next is a turn-by-turn view of what happened under the hood. For each agent response, you’ll see nodes for your LLM, TTS, end-of-turn detection, and tool calls. Each span includes detailed timestamps, duration, and full request and response metadata so you can understand exactly where time was spent and where something went wrong.
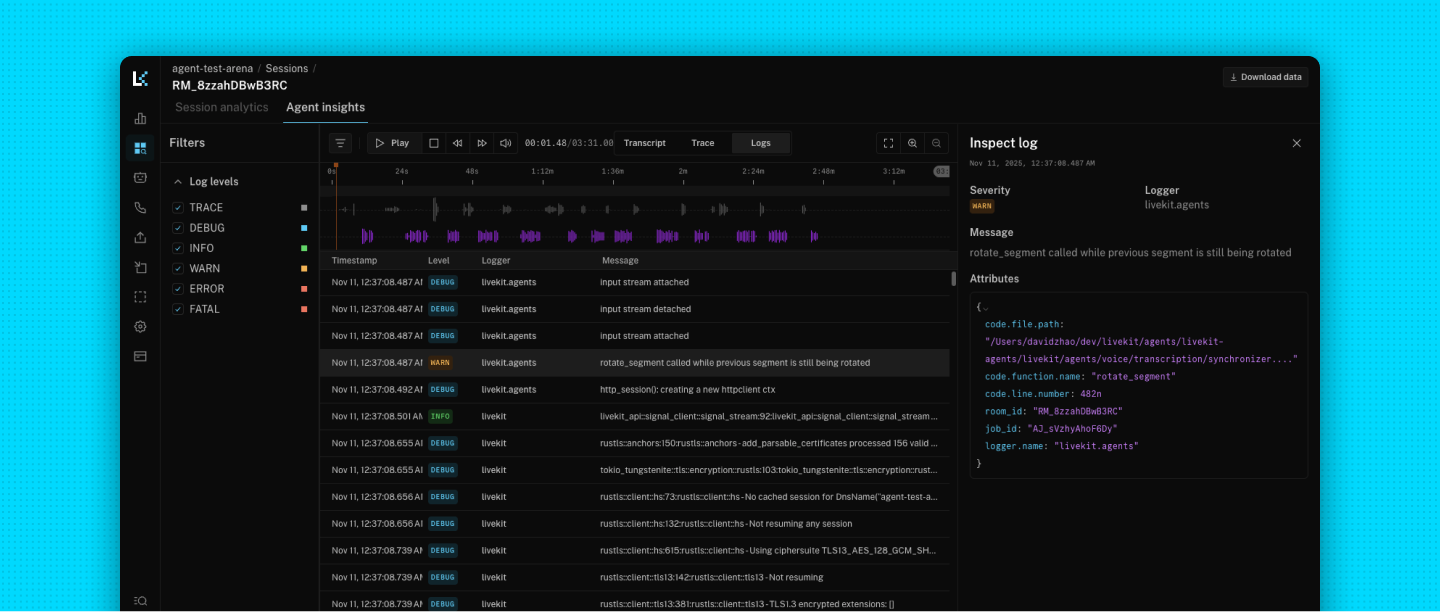
Logs
The third tab shows info, warning, error, and debug messages from across the stack in chronological order. If something failed in your agent code, the media server encountered a network issue, or the client had trouble establishing a connection, you’ll see it here.
A concrete example: fixing a slow, interrupting agent
Imagine you’ve deployed a drive-thru agent that helps users place orders for a fast food establishment.
A user reports that the agent keeps cutting them off and feels sluggish between turns. With Agent Observability, you can:
- Play back the exact call: Open the session, hit play, and scrub to the reported problem area. You can hear the user mid-order and notice the agent barges in before they finish speaking.
- Check turn detection and model timing: In the Trace view, you see that the end-of-turn detection fires before the user’s utterance actually ends. You also notice that the LLM latency spikes for several turns, adding hundreds of milliseconds before each response is sent.
- Correlate with logs: In the Logs view, you see warnings about a downstream API the agent uses to fetch restaurant menus. Those calls are taking longer than expected, and a timeout occasionally forces the agent to retry.
With all of this in one place, you can quickly conclude that:
- Turn detection is too aggressive and needs tuning.
- The menu API is introducing latency and should be cached or optimized.
- The model and TTS are behaving as expected.
Instead of guessing across three different tools, you get a clear, end-to-end explanation of what the user experienced and what to fix.
How it works
Agent Observability is available in the v1.3+ of the Python Agents SDK, with support for the TypeScript Agents SDK coming soon.
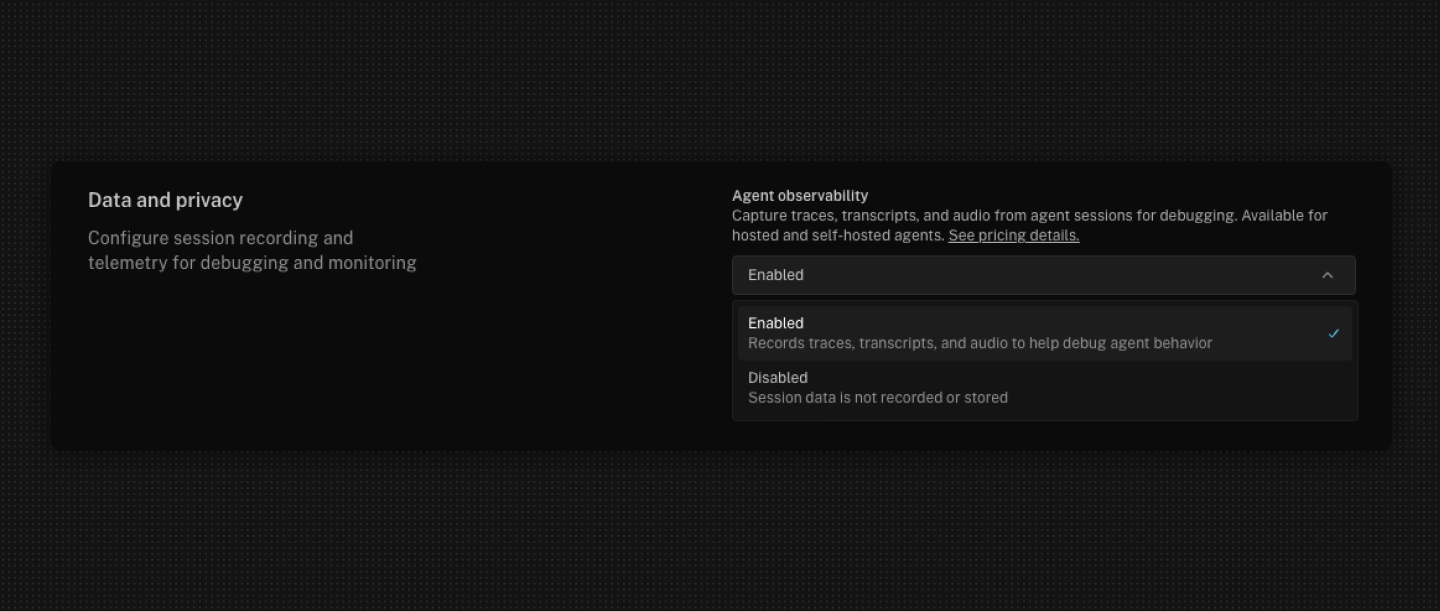
Recording sessions is optional and can be controlled at the project level or at the individual agent level. For both new and existing projects, Agent Observability will be disabled by default.
To enable it, navigate to the Data and privacy section of your project’s Settings page:
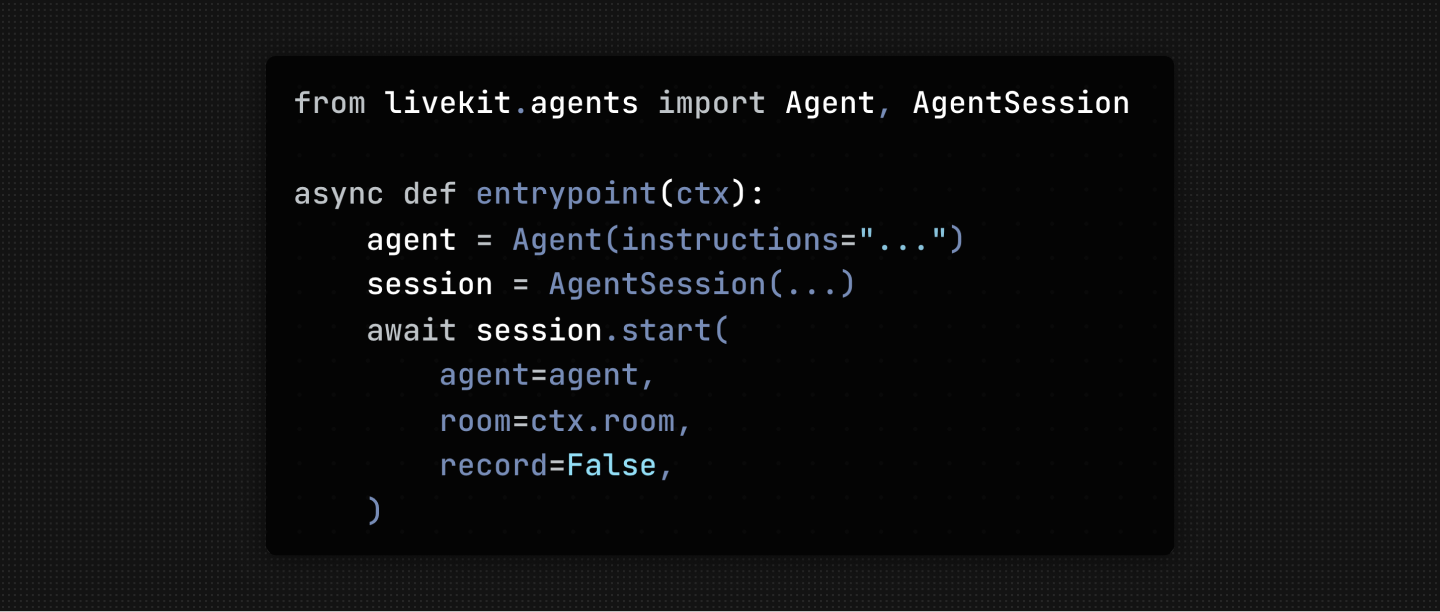
To disable observability at the agent-level, set record=False in your agent code. The agent will not record any data, even if the project-level setting is enabled.
All observability data is currently stored in the US and retained for 30 days. We’re working on offering localized data storage by region in the coming weeks.
If you need a copy of your data, you can download the audio, transcript, and logs directly from the session. We’re also planning to add support for automatically exporting session data to your own cloud storage.
What’s next
Agent Observability gives you a detailed view of a single agent session. From here, we’re already working on:
- Aggregate metrics across sessions so you can spot patterns, regressions, or outliers across agents and deployments.
- Automated testing, evaluations, and simulations built on top of session data, so you can continuously validate changes to prompts, models, and tools before rolling them out to production traffic.
Try the beta for free today
Agent Observability is available today for all LiveKit Cloud users. During the beta period, usage is free through the end of the year.
Give it a try — we’d love to hear what you think. Share your feedback in the #agents channel in our community Slack.