Going beyond a single-core

A look at how we’ve pushed participant limits in WebRTC
Background
In preparation for our LiveKit launch, we needed to know (and share) how many participants could join a room running on our stack. So, we spun up a server, created a video call, and started sending hundreds of headless Chrome bots to our test room.
With two video publishers, only 200 participants could join before those publisher streams began to lag, freeze, and ultimately, transcend into the works of Jackson Pollock.
This is expected when trying to scale an SFU. For n publishers, each sending data to m subscribers, it has O(n*m) (or, if everyone is publishing, O(n^2)) work to do. Therefore, the suspected bottleneck was the following (simplified) function, which reads one audio or video packet at a time from a publisher (buffer.Read()) and forwards them to the other participants (downTracks).
func (w *WebRTCReceiver) writeRTP() {
   for {
      pkt := w.buffer.Read()
   }
}
For a typical video track, a new packet comes in every ~5ms, then the dt.WriteRTP(pkt) call encrypts and writes the data, which we found takes ~50µs per down track. Since this function is running in a goroutine, it’s restricted to a single CPU, and write time scales linearly with the number of participants in the room.
Being real time, it makes sense that quality would suffer once we began publishing to more than 100 down tracks. Quality would continue degrading as more subscribers joined, regardless of how much memory or how many processors are thrown at the problem.
Benchmarking
First, to simulate dt.WriteRTP(pkt), I used a looped hashing function to ensure CPU usage was roughly 50µs with a bit of variance:
func writeRTP() {
   s := []byte("simulate some work")
   stop := 1900 + rand.Intn(200)
   for j := 0; j < stop; j++ {
      h := fnv.New128()
      s = h.Sum(s)
   }
}
Attempt 1: Worker pool
I assumed the ideal solution would be a worker pool with the same number of workers as machine CPUs, which would split the work evenly while reducing the overhead of spinning up goroutines.
func BenchmarkWriteRTP(b *testing.B) {
   cases := []int{1, 2, 5, 10, 100, 250, 500}
   workers := runtime.NumCPU()
   wp := workerpool.New(workers)
   for _, c := range cases {
      buckets := make([]int, workers)
      for i := range buckets {
         buckets[i] = c / workers
      }
      for i := 0; i < c%workers; i++ {
         buckets[i]++
      }

      b.Run(fmt.Sprintf("%d-Downtracks/Control", c),
         func(b *testing.B) {
            benchmarkNoPool(b, c)
         })
      b.Run(fmt.Sprintf("%d-Downtracks/Pool", c),
         func(b *testing.B) {
            benchmarkPool(b, wp, buckets)
         })
   }
}
// original implementation
func benchmarkControl(b *testing.B, downTracks int) {
   for i := 0; i < b.N; i++ {
      for dt := 0; dt < downTracks; dt++ {
         writeRTP()
      }
   }
}
// parallel solution
func benchmarkPool(b *testing.B, wp *workerpool.WorkerPool, buckets []int) {
   for i := 0; i < b.N; i++ {
      var wg sync.WaitGroup
      for j := range buckets {
         downTracks := buckets[j]
         if downTracks == 0 {
            continue
         }
         wg.Add(1)
         wp.Submit(func() {
            defer wg.Done()
            for dt := 0; dt < downTracks; dt++ {
               writeRTP()
            }
         })
      }
      wg.Wait()
   }
}
A WaitGroup is used here because packets need to be sent in order. Each packet should be sent to every down track before moving to the next one.
The results:
BenchmarkWriteRTP/1-Downtracks/Control-12                28833 ns/op
BenchmarkWriteRTP/1-Downtracks/Pool-12                   32594 ns/op

BenchmarkWriteRTP/2-Downtracks/Control-12                60639 ns/op
BenchmarkWriteRTP/2-Downtracks/Pool-12                   55102 ns/op

BenchmarkWriteRTP/5-Downtracks/Control-12               153089 ns/op
BenchmarkWriteRTP/5-Downtracks/Pool-12                  138669 ns/op

BenchmarkWriteRTP/10-Downtracks/Control-12              315284 ns/op
BenchmarkWriteRTP/10-Downtracks/Pool-12                 306799 ns/op

BenchmarkWriteRTP/100-Downtracks/Control-12            2891942 ns/op
BenchmarkWriteRTP/100-Downtracks/Pool-12               2127167 ns/op

BenchmarkWriteRTP/250-Downtracks/Control-12            7932623 ns/op
BenchmarkWriteRTP/250-Downtracks/Pool-12               5505637 ns/op

BenchmarkWriteRTP/500-Downtracks/Control-12           14376374 ns/op
BenchmarkWriteRTP/500-Downtracks/Pool-12              10202644 ns/op
It’s pretty clear that for more than one down track, the pool is faster, but also seemed like it could improve. There were two possible issues with the pool that stood out:
- The pool uses channels to send jobs to workers. While channels are simple to use, they are not performant.
- Due to the wait group, each iteration blocks on the slowest worker, with some finishing much earlier than others.
Attempt 2: Goroutines
To skirt these limitations, I tried spawning a new goroutine for each down track instead. I expected this to perform worse due to the overhead of spawning hundreds of goroutines, but nonetheless added another benchmark:
func benchmarkGoroutine(b *testing.B, buckets []int) {
   for i := 0; i < b.N; i++ {
      var wg sync.WaitGroup
      for j := range buckets {
         downTracks := buckets[j]
         if downTracks == 0 {
            continue
         }
         wg.Add(1)
         go func() {
            defer wg.Done()
            for dt := 0; dt < downTracks; dt++ {
               writeRTP()
            }
         }()
      }
      wg.Wait()
   }
}
The results surprised me:
BenchmarkWriteRTP/1-Downtracks/Pool-12                   32594 ns/op
BenchmarkWriteRTP/1-Downtracks/Goroutines-12             31939 ns/op

BenchmarkWriteRTP/2-Downtracks/Pool-12                   55102 ns/op
BenchmarkWriteRTP/2-Downtracks/Goroutines-12             54951 ns/op

BenchmarkWriteRTP/5-Downtracks/Pool-12                  138669 ns/op
BenchmarkWriteRTP/5-Downtracks/Goroutines-12            136140 ns/op

BenchmarkWriteRTP/10-Downtracks/Pool-12                 306799 ns/op
BenchmarkWriteRTP/10-Downtracks/Goroutines-12           299996 ns/op

BenchmarkWriteRTP/100-Downtracks/Pool-12               2127167 ns/op
BenchmarkWriteRTP/100-Downtracks/Goroutines-12         2137985 ns/op

BenchmarkWriteRTP/250-Downtracks/Pool-12               5505637 ns/op
BenchmarkWriteRTP/250-Downtracks/Goroutines-12         5468421 ns/op

BenchmarkWriteRTP/500-Downtracks/Pool-12              10202644 ns/op
BenchmarkWriteRTP/500-Downtracks/Goroutines-12        10339754 ns/op
Goroutines are cheap! It performed just as well as the pool — trading channel time and waiting for the slowest worker for goroutine overhead.
So, was there a way to get around the pool’s issues without spawning hundreds of goroutines? 🤔
Attempt 3: Load balancing
The main idea of this approach is having each goroutine take a bit of work at a time. An atomic uint64 is used to coordinate which down tracks to send the packet to, which avoids the use of channels.
Each goroutine also takes only a couple iterations at a time (defined by step), so if one falls behind, the others can pick up the slack, avoiding having to wait a potentially long time for the slowest worker.
func benchmarkLoadBalanced(b *testing.B, numProcs, step, downTracks int) {
   for i := 0; i < b.N; i++ {
      start := uint64(0)
      step := uint64(step)
      end := uint64(downTracks)

      var wg sync.WaitGroup
      wg.Add(numProcs)
      for p := 0; p < numProcs; p++ {
         go func() {
            defer wg.Done()
            for {
               n := atomic.AddUint64(&start, step)
               if n >= end+step {
                  return
               }

               for i := n - step; i < n && i < end; i++ {
                  writeRTP()
               }
            }
         }()
      }
      wg.Wait()
   }
}
Golang’s testing package uses a similar approach for running parallel benchmarks, and they included this comment:
// Calculate grain size as number of iterations that take ~100µs.
// 100µs is enough to amortize the overhead and provide sufficient
// dynamic load balancing.
Since each iteration should take 50µs, that would make 2 our ideal step size, which I confirmed after testing a number of different values.
The final results
It worked! From the full benchmark results (published below), it’s clear the load balance method worked best for 5+ down tracks. The takeaways:
- Channels are (relatively) slow.
- Goroutines have less overhead than traditional threads.
- Letting workers pull individual jobs will produce better results than pre-assigning chunks of work.
Having removed this bottleneck, we hit 400 participants subscribing to 4 publishers sans issue — up to 1600 down tracks from the previous 400–500! Most importantly, this approach scales to fully utilize all cores on the box (Note: benchmarking was performed on a 16-core machine).
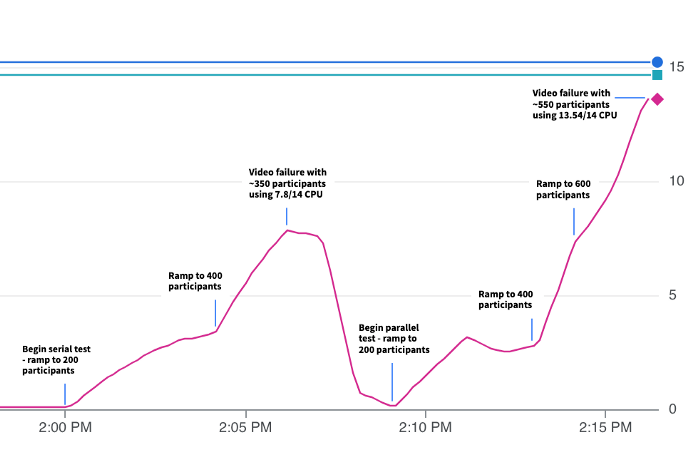
This utilization is demonstrated in the chart below — the left half shows the original serial method, which fails while using only around half of the 14 available cores. On the right side, we have the new load-balanced method, which is able to leverage the extra cores to handle another 200 participants. Both cases used a single publisher.
There are still improvements we’re making to unlock even greater scale, but that will be the topic of a future post.
In my final implementation, I stuck with the serial method for less than 5 down tracks and the load balanced method beyond that threshold. For simple use cases, the extra overhead is unnecessary. You can find the actual implementation here, along with the benchmarks.
goos: darwin
goarch: amd64
pkg: github.com/pion/ion-sfu/pkg/sfu
cpu: Intel(R) Core(TM) i7-8850H CPU @ 2.60GHz

BenchmarkWriteRTP/1-Downtracks/Control-12                28833 ns/op
BenchmarkWriteRTP/1-Downtracks/Pool-12                   32594 ns/op
BenchmarkWriteRTP/1-Downtracks/Goroutines-12             31939 ns/op
BenchmarkWriteRTP/1-Downtracks/LoadBalanced-12           35820 ns/op

BenchmarkWriteRTP/2-Downtracks/Control-12                60639 ns/op
BenchmarkWriteRTP/2-Downtracks/Pool-12                   55102 ns/op
BenchmarkWriteRTP/2-Downtracks/Goroutines-12             54951 ns/op
BenchmarkWriteRTP/2-Downtracks/LoadBalanced-12           67199 ns/op

BenchmarkWriteRTP/5-Downtracks/Control-12               153089 ns/op
BenchmarkWriteRTP/5-Downtracks/Pool-12                  138669 ns/op
BenchmarkWriteRTP/5-Downtracks/Goroutines-12            136140 ns/op
BenchmarkWriteRTP/5-Downtracks/LoadBalanced-12          131867 ns/op

BenchmarkWriteRTP/10-Downtracks/Control-12              315284 ns/op
BenchmarkWriteRTP/10-Downtracks/Pool-12                 306799 ns/op
BenchmarkWriteRTP/10-Downtracks/Goroutines-12           299996 ns/op
BenchmarkWriteRTP/10-Downtracks/LoadBalanced-12         278264 ns/op

BenchmarkWriteRTP/100-Downtracks/Control-12            2891942 ns/op
BenchmarkWriteRTP/100-Downtracks/Pool-12               2127167 ns/op
BenchmarkWriteRTP/100-Downtracks/Goroutines-12         2137985 ns/op
BenchmarkWriteRTP/100-Downtracks/LoadBalanced-12       2105069 ns/op

BenchmarkWriteRTP/250-Downtracks/Control-12            7932623 ns/op
BenchmarkWriteRTP/250-Downtracks/Pool-12               5505637 ns/op
BenchmarkWriteRTP/250-Downtracks/Goroutines-12         5468421 ns/op
BenchmarkWriteRTP/250-Downtracks/LoadBalanced-12       5249865 ns/op

BenchmarkWriteRTP/500-Downtracks/Control-12           14376374 ns/op
BenchmarkWriteRTP/500-Downtracks/Pool-12              10202644 ns/op
BenchmarkWriteRTP/500-Downtracks/Goroutines-12        10339754 ns/op
BenchmarkWriteRTP/500-Downtracks/LoadBalanced-12       9870237 ns/op
For those wondering, “What about a load balanced pool?”, I’ve added that here for completeness, and found the overhead of channel usage roughly equivalent to spawning the goroutines. Since the worker pool tries to be smart and shuts down idle workers, I went with the simpler goroutine option.
BenchmarkWriteRTP/1-Downtracks/LoadBalanced-12           35386 ns/op
BenchmarkWriteRTP/1-Downtracks/LoadBalancedPool-12       36249 ns/op

BenchmarkWriteRTP/2-Downtracks/LoadBalanced-12           67137 ns/op
BenchmarkWriteRTP/2-Downtracks/LoadBalancedPool-12       67822 ns/op

BenchmarkWriteRTP/5-Downtracks/LoadBalanced-12          126648 ns/op
BenchmarkWriteRTP/5-Downtracks/LoadBalancedPool-12      131487 ns/op

BenchmarkWriteRTP/10-Downtracks/LoadBalanced-12         256083 ns/op
BenchmarkWriteRTP/10-Downtracks/LoadBalancedPool-12     269512 ns/op

BenchmarkWriteRTP/100-Downtracks/LoadBalanced-12       1926856 ns/op
BenchmarkWriteRTP/100-Downtracks/LoadBalancedPool-12   1898385 ns/op

BenchmarkWriteRTP/250-Downtracks/LoadBalanced-12       5466619 ns/op
BenchmarkWriteRTP/250-Downtracks/LoadBalancedPool-12   4862106 ns/op

BenchmarkWriteRTP/500-Downtracks/LoadBalanced-12       9887975 ns/op
BenchmarkWriteRTP/500-Downtracks/LoadBalancedPool-12  10004182 ns/op